Traffic Indexing
Kubeshark indexes cluster-wide network traffic by parsing it according to protocol specifications, with support for HTTP, gRPC, Redis, Kafka, DNS, and more. Dissected elements are broken down to the smallest protocol components and stored in a database. This enables queries using Kubernetes semantics (e.g. pod, namespace, node), API semantics (e.g. path, headers, status), and network semantics (e.g. IP, port) — whether from a dashboard or from an AI agent. No code instrumentation required.
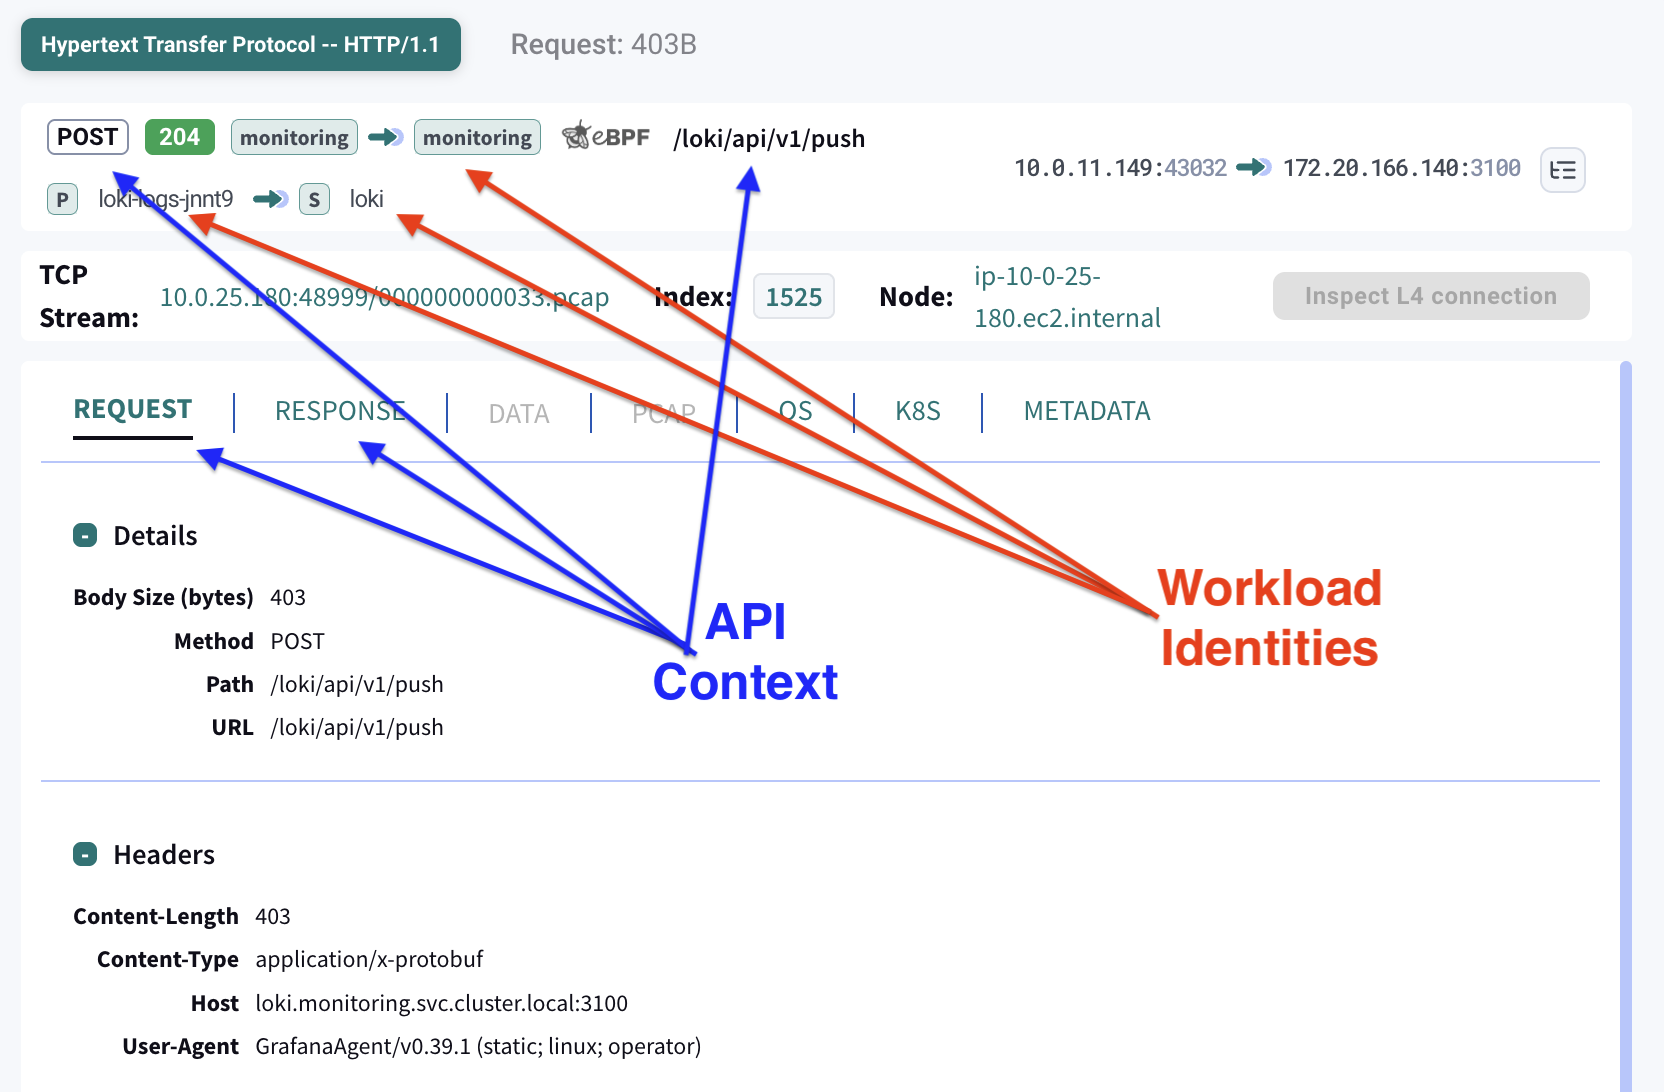
Queries with API, Kubernetes and Network Semantics
Dissected API components, enriched with Kubernetes and network contexts, are stored in a DB, ready for queries with Kubernetes, network, and API semantics.
dst.pod.name == "bifrost-0" && http && dst.port == 8000 && path.contains("/v1/chat/completions")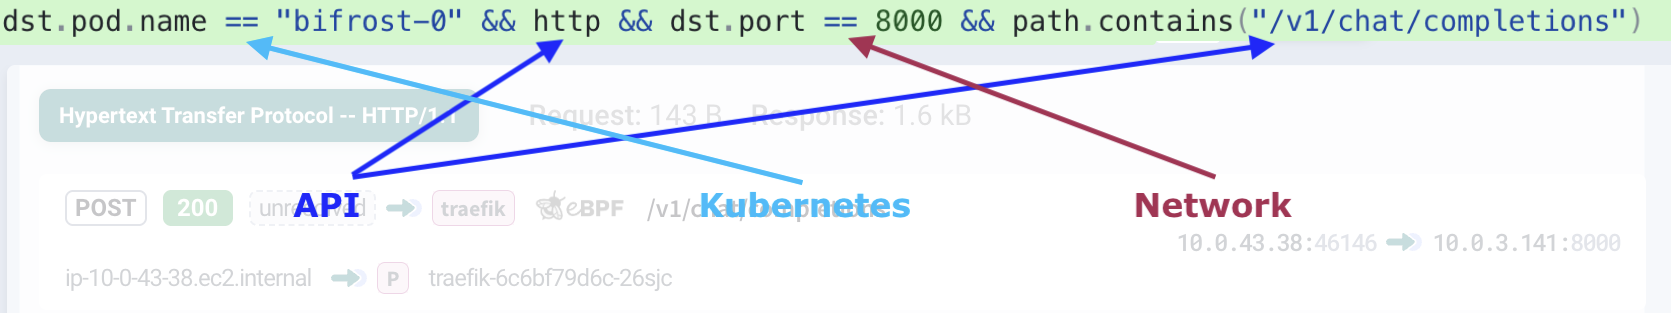
Query language covers most Kubernetes identifiers (e.g. pod, service, namespace, labels, annotations, node, etc), IPs and ports as network identifiers, and every API component based on supported protocol specs.
Kubernetes Semantics
Kubernetes orchestrates workload identities (e.g., service, pod, namespace). It’s impossible to establish workload identities by inspecting raw packets alone. To establish workload identities, Kubeshark maintains a name-to-IP resolution table that enables correlating IP addresses to workload identities.
For each peer (e.g., source or destination), the following information is presented:
- Service name
- Pod name
- Namespace
- Node
This comes in addition to:
- IP
- Port
- Protocol
Network Semantics
Network-level identifiers are available for every captured packet:
- Source and destination IP
- Source and destination port
- Protocol (TCP, UDP, SCTP)
These can be used independently or combined with Kubernetes and API semantics for precise filtering.
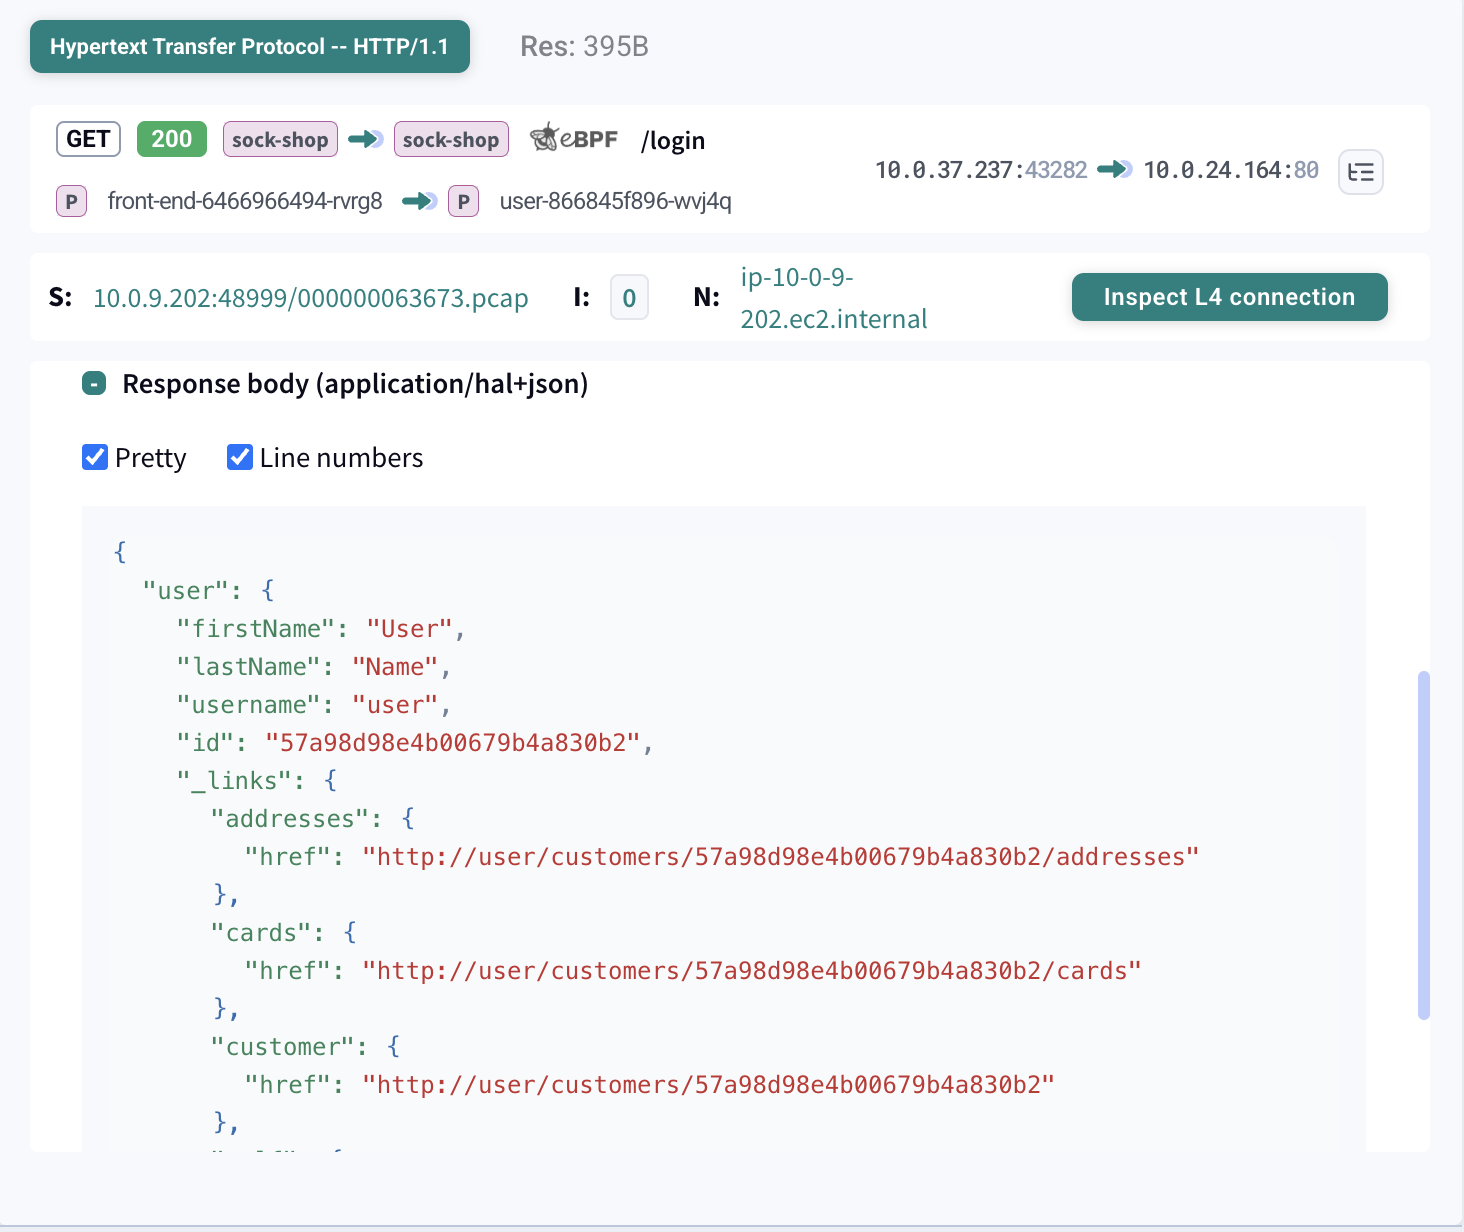
API Semantics
API components are parsed according to protocol specifications. For example, in HTTP, the following information is parsed:
- Request
- Matched response
- API endpoint
- Headers
- Payload
- Response status code
Real-time vs Delayed Indexing
Kubeshark offers two independent indexing modes that can run in parallel or separately. Each can be enabled or disabled independently.
| Approach | Compute | How It Works | When to Use |
|---|---|---|---|
| Real-time | Production (worker nodes) | Automatically dissects traffic as it flows, in real time | Active debugging, development, live investigation |
| Delayed | Non-production | Raw Capture → Snapshot → Dissection | Production monitoring, forensics, incident response |
The two pipelines are independent. Real-time indexing does not capture raw traffic — it dissects on the fly using production resources. Delayed indexing relies on a separate pipeline: Raw Capture stores packets continuously, Traffic Snapshots preserve a time window, and dissection runs later on non-production compute.
For detailed resource consumption information, see Performance.
Real-time Indexing
Real-time indexing provides instant visibility into L7 traffic as it happens. Requests and responses are parsed, correlated, and displayed immediately in the Dashboard.
| Feature | Description |
|---|---|
| Live traffic view | See API calls as they occur |
| Request/response correlation | Matched pairs with timing |
| Full payload inspection | Headers, body, status codes |
| Kubernetes context | Pod, service, namespace identity |
Real-time indexing uses a distributed, federated database architecture. Each worker node runs its own DB instance, where traffic is dissected on the wire and stored locally. When a query is issued — from the dashboard, MCP, or API — the Hub routes it to the relevant DB instances and aggregates the results.
This means real-time indexing consumes production compute resources on every worker node. If production resource usage is a concern and you can wait for results, use delayed indexing instead.
Delayed Indexing
Delayed indexing enables full L7 protocol analysis on captured traffic using non-production compute. Capture raw packets on production nodes with minimal overhead, then run complete protocol analysis later — on your schedule.
The result is identical to real-time indexing: full request/response payloads, headers, timing, and Kubernetes context. Unlike real-time’s federated DB across worker nodes, a snapshot produces a single centralized DB stored on the Hub — queryable from the dashboard or via MCP, and capable of being uploaded to cloud storage for long-term retention.
PRODUCTION                           NON-PRODUCTION
+------------------+                 +------------------+
|                  |                 |                  |
|  Raw Capture     |--- Snapshot --->|  L7 Dissection   |
|  (minimal CPU)   |                 |  (full parsing)  |
|                  |                 |                  |
+------------------+                 +--------+---------+
                                              |
                                              v
                                     +------------------+
                                     |  Dissection DB   |
                                     |  (queryable)     |
                                     +------------------+
Workflow
- Capture: Raw Capture continuously stores L4 traffic with minimal CPU
- Snapshot: Create a Traffic Snapshot for the time window of interest
- Dissect: Run L7 protocol analysis on the snapshot
- Query: Access the dissected data via the Dashboard or MCP
Key Benefits
- Production safe — Raw capture uses minimal CPU. The heavy lifting of protocol parsing happens elsewhere.
- No data loss — Since capture requires minimal resources, packet loss is eliminated.
- Flexible timing — Run dissection immediately after an incident, periodically in the background, or on-demand.
- Complete context — Produces the same rich data as real-time: full payloads, headers, status codes, timing, and Kubernetes identity.